|
Home Page | Products | Contact Us | News & Events | Request Info. |
||||
|
|
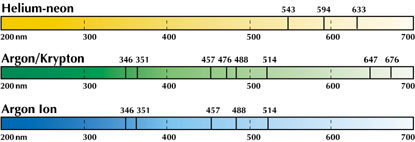
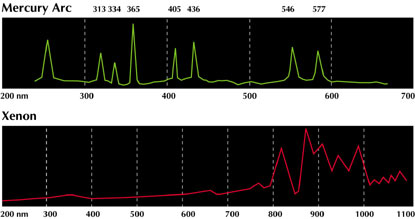
Light Sources & Detectors |
|
||
|
|
||||


|
|
|
||||||||||||||||||
|
|
|||||||||||||||||||
Arc Lamps |
|||||||||||||||||||
|
|
|||||||||||||||||||
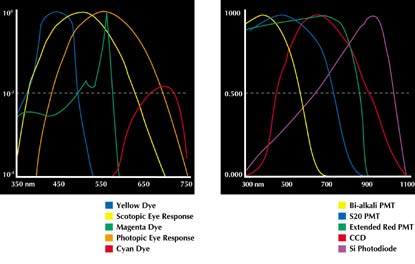
Detectors |
|||||||||||||||||||
|
Left Graph: The above chart illustrates the relative spectral response of the commonly used detectors; photopic human eye, scotopic human eye and colour film. Right Graph: Normalised response of bi-alkali PMT detector, extended red PMT detector, silicon detector, S20 PMT and CCD.
|
|
Back to top | Home Page | Products | Contact Us | News & Events | Request Info. |
|
|
|
|
|
|
|
|
Copyright © 2007 Glen Spectra All rights reserved |
|